
The short version
- Two things kill most creative tests: changing too much at once (the result tells you nothing) and calling it too early (reading noise as signal).
- Before launch, lock in your primary metric, baseline conversion rate, minimum detectable effect, sample size, and stop rule. Don't pick a winner off a fixed conversion count or a curve you liked the look of.
- Be honest about where AI sits: it solves supply, so you can actually produce 20 variants worth testing. Traffic splitting and statistics stay with the ad platform's experiment tools.
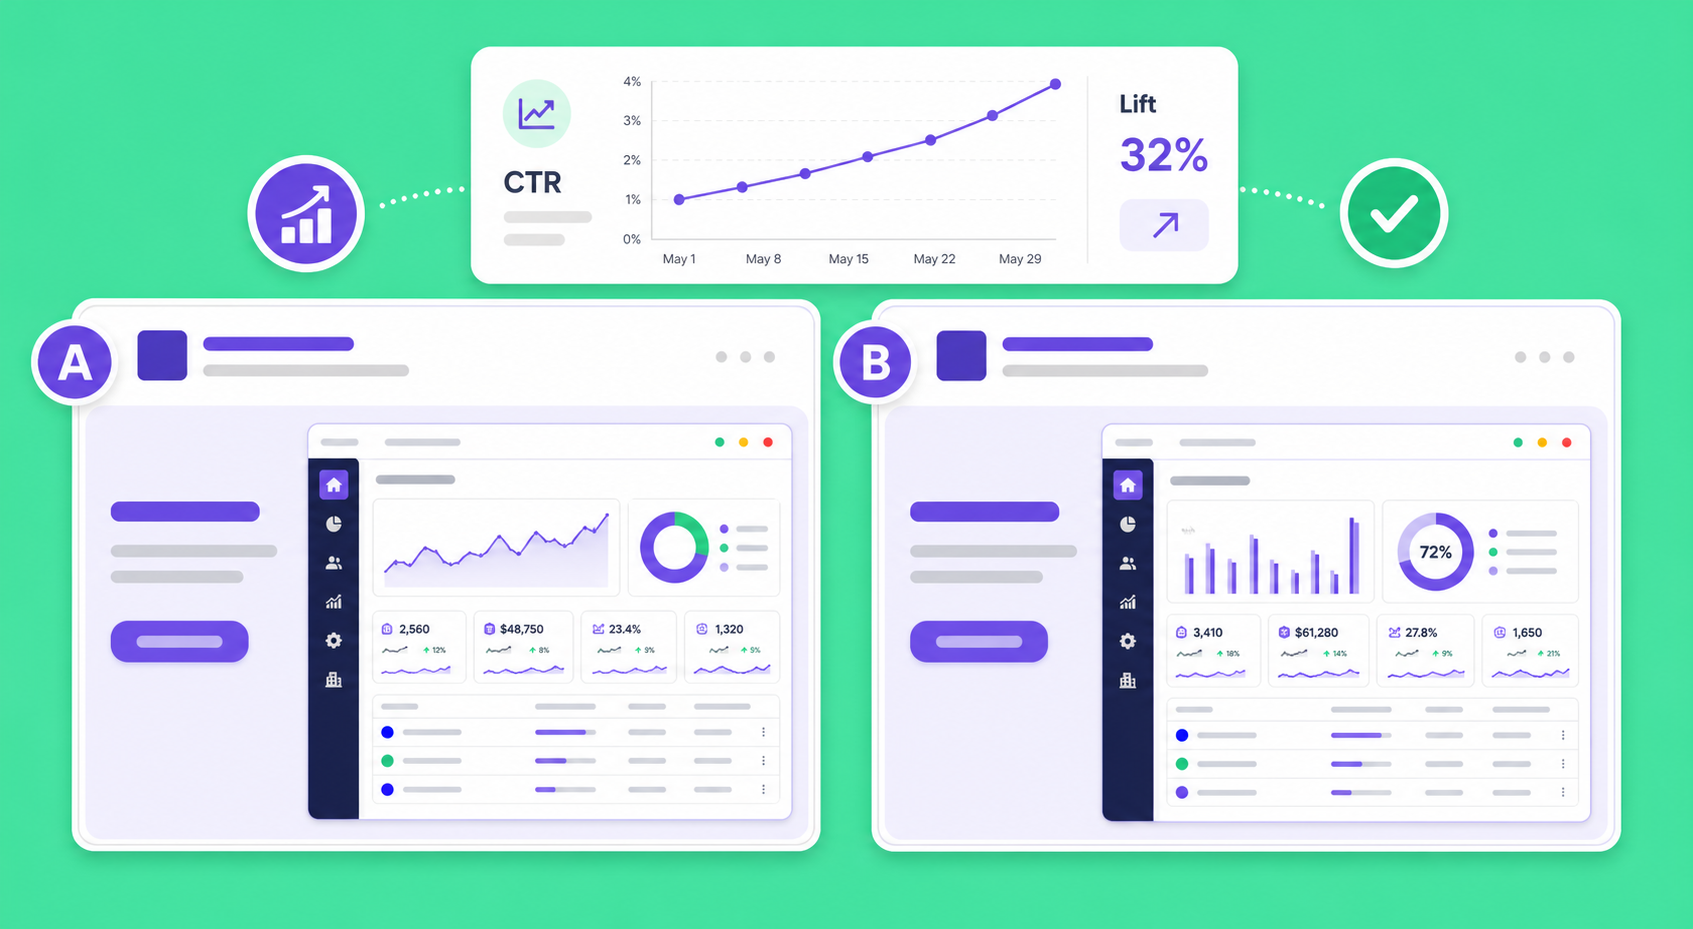
One thing up front, so there's no confusion later: LinkBloom does not split traffic or run experiments. Splitting traffic, running the test, and computing significance are handled by the experiment tools inside your ad platform (Meta Experiments, TikTok Ads A/B tests). This article is about method, and about which part of the process AI genuinely helps with. Get the method right and it works with whatever tool you buy media in.
A test is not "pick the better image"
Plenty of teams think an A/B test means making two images, running both, and keeping whichever gets more clicks. Do it that way and eight tests out of ten teach you nothing.
A real A/B test is a controlled experiment. You have to be able to answer one question: what caused the difference? If A and B differ in headline, color, and CTA all at once and B wins, you still don't know which of the three did it. Next time you reach for that "lesson," there's nothing there to apply.
The whole discipline reduces to one sentence: know what you're testing.
Change one variable at a time
This is the rule that matters most, and it isn't close. One experiment, one variable. Everything else stays identical.
Testing a headline means A and B differ in the headline and nothing else: same image, same CTA, same audience, same bid. Then when B wins, the headline gets the credit.
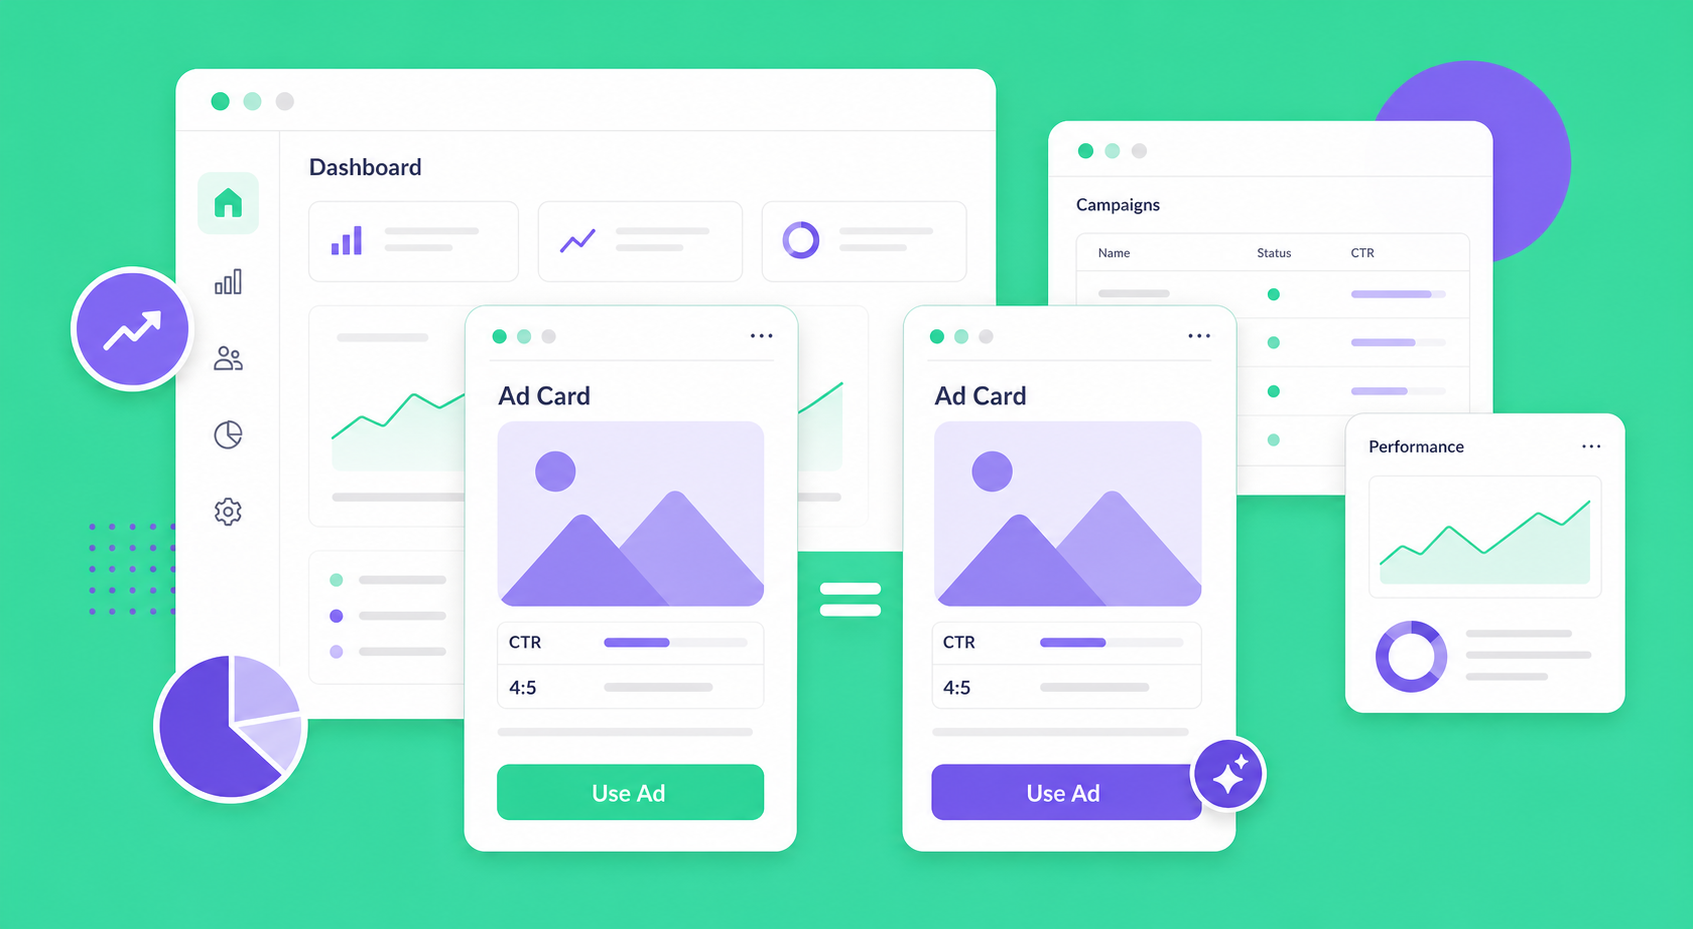
The usual objection: this is too slow, and you'd rather test headline and color in the same run. You can, but that's multivariate testing, and the sample it needs climbs fast. A small budget will never fill it. For most SaaS teams and solo founders, one variable at a time is the quickest route to a conclusion you can trust. This is not the step to rush.
What to test first
Variables are not equal. Some swing the result hard; others do nothing no matter how long you fiddle with them. Start with the big ones.
| Variable | Impact | Notes |
|---|---|---|
| Angle / core benefit | Highest | "Saves you hours" and "cuts your costs" can pull very different numbers |
| Main visual | High | Product screenshot, scene, or person. It's the first thing people see |
| Headline | High | One line either lands or it doesn't, and that decides whether anyone stops |
| Audience targeting | High | The same image performs completely differently depending on who sees it |
| CTA copy | Medium | "Start free" versus "Buy now" |
| Color and small details | Low | Worst return on effort, especially early |
The rookie move is to open with a debate about button color. Spend your early cycles on angle and main visual. Their ceiling is far higher than anything you'll get from color tweaks. Save color for late-stage tuning.
Sample size and runtime: write the stop rule first
Reading results too early is the second big trap, right behind changing too much at once. B leading on a handful of conversions says almost nothing about how the full run ends.
There's no universal "100 conversions per arm." The sample you need depends on your baseline conversion rate, the smallest lift you care about, your significance level, and your statistical power. Microsoft's experimentation team put a number on how bad this can get in Seven Rules of Thumb for Web Site Experimenters (KDD 2014): Bing's Revenue/User metric has a skewness of 17.9, and detecting a 4.4% change at 80% power took roughly 114,000 users. The more skewed the metric, the more absurd the requirement, and no amount of eyeballing will tell you that. A more reliable way to plan it:
- Pick one primary metric. Signup, paid conversion, or whatever sits closest to the business goal. One, not three.
- Define the minimum detectable effect first. Decide what size of lift would actually change how you spend. Anything below that isn't worth chasing.
- Estimate the sample with the platform's tool or a sample-size calculator. Feed it baseline rate, target lift, significance level, and power together.
- Cover a full business cycle. If weekdays and weekends behave differently, run through both. The same paper recommends running a full two weeks so novelty effects have time to decay — the spike a new asset gets in its first days isn't its steady state. Log promos, holidays, and budget changes separately.
- Read the winner only at the stop condition you wrote down. Don't end early because the curve is temporarily ahead, and don't extend indefinitely until you get the answer you wanted. If you genuinely need to watch a test as it runs, use statistics built for continuous monitoring; repeatedly refreshing an ordinary p-value inflates your false-positive rate badly.
Small budget, few conversions? Then don't test fine-grained variables. An experiment that never fills its sample produces conclusions you can't trust, and a conclusion you can't trust is worse than no test at all. Test the angle and leave the color alone.
Reading results without fooling yourself
Results are in. Don't celebrate yet. A few reminders:
- Look at absolute counts, not just rates. "B's CTR is 50% higher" means nothing when A got 2 clicks and B got 3.
- A higher CTR doesn't mean better conversions. Some creative pulls clicks from people who never buy. Judge on the metric closest to revenue (signup, paid), not on the click.
- One win is not a finding. A repeat is. Real insight replicates. When B's angle wins again with a different audience in a different week, it's a lesson worth keeping. And don't expect drama: in Microsoft's rules of thumb, successful experiments typically move a key metric by 0.1% to 1.0%. A result far outside that range is usually a broken split or broken instrumentation, not a breakthrough.
Where AI actually fits
Back to the opening. The biggest bottleneck in creative testing usually isn't that you can't analyze the data, it's that you can't produce enough to test. You want to try 20 angles, you can make three, and your coverage ends up capped by production rather than by budget or statistics.
That's the gap AI closes. Creative Factory fans out dozens of angle variants from a single product, so you have enough candidates to work with. If you do not have a reusable first set yet, start with the SaaS marketing assets workflow to separate product facts, audience, and claim. Once supply stops being the constraint, the testing program can actually run.
Keep the line clear: AI produces the variants; the ad platform still splits traffic and calls the winner. LinkBloom doesn't decide who won for you. It gives you something to test. Put the two together and you have the full loop: AI supplies the variants, the platform runs the experiment. For how the generation side works, what AI ad creative generation is covers the full picture.
Want a batch of variants to test with? New accounts get 100 one-time credits and each image costs 10. Start free and generate a set of angles in one run.
FAQ
My budget is tiny. Is A/B testing still worth it?
Yes, but keep it coarse. A small budget won't fill the sample a fine-grained variable needs, so skip color and button tests entirely. Put everything into the highest-impact variable, the persuasion angle, and trade your limited conversion data for the most valuable conclusion you can get.
Can LinkBloom run the A/B test for me?
No, and it shouldn't. Splitting traffic, running the experiment, and computing significance are the ad platform's job. LinkBloom handles the step upstream of that: producing enough creative variants that you have something worth testing. They work together; neither replaces the other.
How long should one experiment run?
There's no fixed number of days. Estimate the sample from your baseline conversion rate and minimum detectable effect, then convert it to runtime using your daily traffic. If weekday and weekend behavior differ noticeably, cover a full cycle. Draw conclusions once you hit the planned sample and stop condition, not before.
References
- Meta: A/B testing for ad experiments
- Meta: Experiments and randomized split assignment
- Kohavi et al., Seven Rules of Thumb for Web Site Experimenters (KDD 2014)
- Johari et al., Always Valid Inference: Bringing Sequential Analysis to A/B Testing (2015)
Sources checked July 23, 2026. Statistical conventions and stop rules vary between platforms; defer to the experiment tool in the platform you're actually running on.